
 The Famous Five
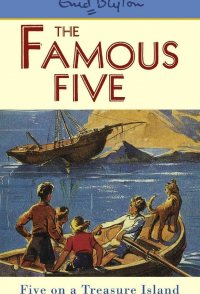
Total votes: 449
Average rating: 5.9
 The Search
Total votes: 297
Average rating: 6.0
 M - A City Hunts a Murderer
Total votes: 318
Average rating: 5.8
 Dünentod - Ein Nordsee-Krimi
Total votes: 280
Average rating: 5.8
 The Holiday
Total votes: 197
Average rating: 5.0
 Flesh
FleshTotal votes: 352
Average rating: 5.2
 Parot
ParotTotal votes: 353
Average rating: 5.8
 Das Quartett
Total votes: 317
Average rating: 5.7
 Walgericht: Black Forest Crime
Total votes: 52
Average rating: 5.8
 Sincerely Floyd
Total votes: 121
Average rating: 4.9