Rating Graph is an online visualization tool which generates fancy graphs about TV shows and Movies based on 1423 million user ratings. Find your next binge-watch!
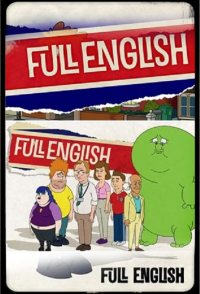
Revolves around the lives of members of a suburban family called the Johnsons. Hard-working Edgar, the father, is employed by Ken, his borderline-evil father-in law, while his house-proud wife, Wendy, looks after their children: the freaky weirdo Dusty, the amiable idiot Jason and the highly strung emo, Eve. Ken's only friend in the show is a large green figment of his imagination called Squidge, who makes him do unpleasant things.
Hint: you can examine a particular season more clearly on the graphs if you disable the trendline and all other seasons (via clicking on their labels).Episodes average ratingNote: season labels indicates the average rating per episode between the parentheses.Episodes total votesNote: season labels indicates the average votes per episode between the parentheses.History (tracking since March 7, 2020)Note: amount of total votes may decrease due to periodic removal of fraudulent ones.
 Rick and Morty
 BoJack Horseman
 Girls of the Sun
 Community
 Gravity Falls
 One Punch Man
 Brooklyn Nine-Nine
 Over the Garden Wall
 Regular Show
 Fullmetal Alchemist: Brotherhood