Rating Graph is an online visualization tool which generates fancy graphs about TV shows and Movies based on 1397 million user ratings. Find your next binge-watch!
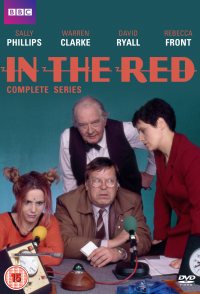
A series of killings of bank managers has London in a turmoil, all the way up to Parliament. And the killer regularly calls about his handiwork, but only to a street-wise, and usually rather tipsy, radio reporter, about to be sacked for his habitual irreverence toward his station and the BBC. And while everything seems to point to a lead singer of a rock group famous for the "In The Red" music which has been connected to the killings, in typical British mystery fashion, there are also other sub-plots to be considered.
Hint: you can examine a particular season more clearly on the graphs if you disable the trendline and all other seasons (via clicking on their labels).Episodes average ratingNote: season labels indicates the average rating per episode between the parentheses.Episodes total votesNote: season labels indicates the average votes per episode between the parentheses.History (tracking since March 7, 2020)Note: amount of total votes may decrease due to periodic removal of fraudulent ones.
 Trautmann
 Sperling
 Forgotten
 Fear Factor
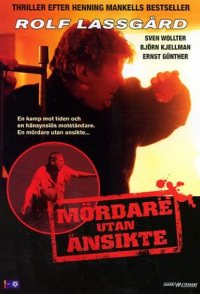 Faceless Murderer
 The Net
 Jakten på en mördare
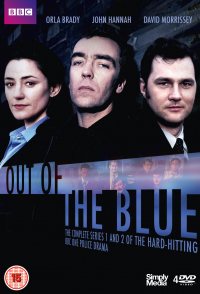 Out of the Blue
 Extremely Dangerous
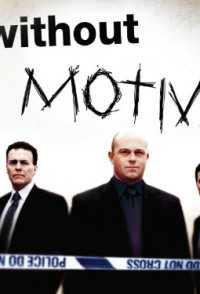 Without Motive