Rating Graph is an online visualization tool which generates fancy graphs about TV shows and Movies based on 1454 million user ratings. Find your next binge-watch!
Sight & Sound in Concert ratings (TV show, 1977-1984)
Innovative series intended to take the idea of pop and rock concerts that are transmitted on the radio, one step further. That step was to present the music as a simultaneous audio-televisual feast.
Hint: you can examine a particular season more clearly on the graphs if you disable the trendline and all other seasons (via clicking on their labels).Episodes average ratingNote: season labels indicates the average rating per episode between the parentheses.Episodes total votesNote: season labels indicates the average votes per episode between the parentheses.History (tracking since March 7, 2020)Note: amount of total votes may decrease due to periodic removal of fraudulent ones.
 Live from Lincoln Center
 Great Performances at the Met
 The Metropolitan Opera Presents
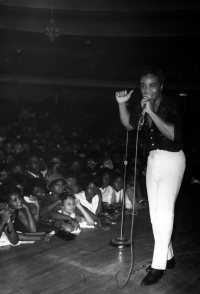 Soundstage
 Rock Goes to College