Rating Graph is an online visualization tool which generates fancy graphs about TV shows and Movies based on 1494 million user ratings. Find your next binge-watch!
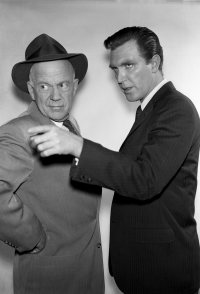
Manhattan's 87th precinct forms the backdrop for this grim and gritty police drama based on the long-running series of novels by Ed McBain. Storylines focus on neighborhood crime, and the lives of the officers of the 87th and their families: Steve Carella and his deaf/mute wife, Teddy; rookie Bert Kling; long-time veteran Roger Havilland and the wryly philosophical Meyer Meyer.
Hint: you can examine a particular season more clearly on the graphs if you disable the trendline and all other seasons (via clicking on their labels).Episodes average ratingNote: season labels indicates the average rating per episode between the parentheses.Episodes total votesNote: season labels indicates the average votes per episode between the parentheses.History (tracking since March 7, 2020)Note: amount of total votes may decrease due to periodic removal of fraudulent ones.
 The Twilight Zone
 The Outer Limits
 Doctor Who
 The Alfred Hitchcock Hour
 Colgate Theatre
 The Fugitive
 Thriller
 The Rifleman
 Wanted: Dead or Alive
 One Step Beyond