Rating Graph is an online visualization tool which generates fancy graphs about TV shows and Movies based on 1532 million user ratings. Find your next binge-watch!
Alex, who is in his mid-30s with a wife and two kids, makes the crazy decision to quit his good job and dive into the brave new world of starting a business.
Hint: you can examine a particular season more clearly on the graphs if you disable the trendline and all other seasons (via clicking on their labels).Episodes average ratingNote: season labels indicates the average rating per episode between the parentheses.Episodes total votesNote: season labels indicates the average votes per episode between the parentheses.History (tracking since March 7, 2020)Note: amount of total votes may decrease due to periodic removal of fraudulent ones.

 The White Lotus
 Only Murders in the Building
 Good Omens
 Sex Education
 The End of the F***ing World
 The Umbrella Academy
 The Orville
 Only Murders in the Building
 The Good Place
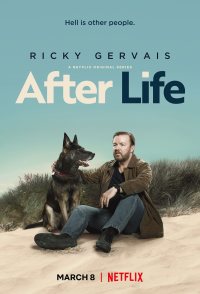 After Life