Rating Graph is an online visualization tool which generates fancy graphs about TV shows and Movies based on 1465 million user ratings. Find your next binge-watch!
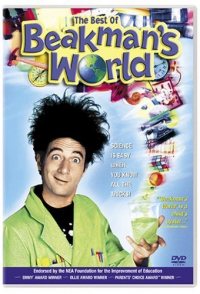
In this show, which works like a cross between Mr. Wizard and Monty Python, the science teacher, Beakman answers viewer questions about science. With the help of his assistants Josie and Lester the Rat, he uses various methods like animation, interviews with famous dead people of science and simple experiments to illustrate scientific principles.
Hint: you can examine a particular season more clearly on the graphs if you disable the trendline and all other seasons (via clicking on their labels).Episodes average ratingNote: season labels indicates the average rating per episode between the parentheses.Episodes total votesNote: season labels indicates the average votes per episode between the parentheses.History (tracking since March 7, 2020)Note: amount of total votes may decrease due to periodic removal of fraudulent ones.
 Friends
 Seinfeld
 Mr. Bean
 Blackadder Goes Forth
 Frasier
 Father Ted
 The Fresh Prince of Bel-Air
 Tales from the Crypt
 Goosebumps
 My So-Called Life