Rating Graph is an online visualization tool which generates fancy graphs about TV shows and Movies based on 1376 million user ratings. Find your next binge-watch!
Follows the life of three friends, T.J., Mack and Kleber. When they were young, something happened that would haunt them for the rest of their lives and they would each achieve notoriety in their own way. Kleber would become a journalist. Mack would get by on his looks and would become a movie star. And T.J., who has a dark side, would run all sorts of scams and would somehow become an evangelist.
Hint: you can examine a particular season more clearly on the graphs if you disable the trendline and all other seasons (via clicking on their labels).Episodes average ratingNote: season labels indicates the average rating per episode between the parentheses.Episodes total votesNote: season labels indicates the average votes per episode between the parentheses.History (tracking since March 7, 2020)Note: amount of total votes may decrease due to periodic removal of fraudulent ones.

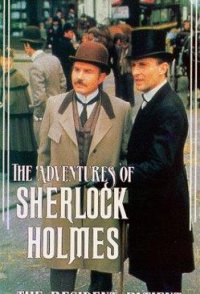 The Adventures of Sherlock Holmes
 Inspector Morse
 The Return of Sherlock Holmes
 Murder, She Wrote
 Anne of Green Gables
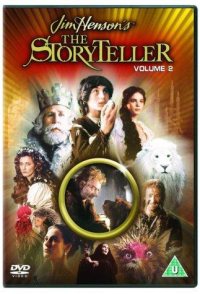 The Storyteller
 Fanny and Alexander
 Das Boot
 The Twilight Zone
 Smiley's People