Rating Graph is an online visualization tool which generates fancy graphs about TV shows and Movies based on 1521 million user ratings. Find your next binge-watch!
Nate and Marni are complete opposites: Nate comes from a long line of geniuses who all eventually go insane; Marni is an occupational therapist and everlasting optimist. Somehow they meet and find a connection that could become love--if they let themselves let it happen. Also, a clown is dying in the closet.
Hint: you can examine a particular season more clearly on the graphs if you disable the trendline and all other seasons (via clicking on their labels).Episodes average ratingNote: season labels indicates the average rating per episode between the parentheses.Episodes total votesNote: season labels indicates the average votes per episode between the parentheses.History (tracking since March 7, 2020)Note: amount of total votes may decrease due to periodic removal of fraudulent ones.

 The Office
 How I Met Your Mother
 It's Always Sunny in Philadelphia
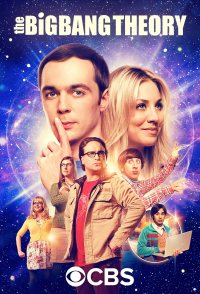 The Big Bang Theory
 Rome
Rome The IT Crowd
 Arrested Development
 Comedy Central Roasts
 Chuck
Chuck The Inbetweeners