Rating Graph is an online visualization tool which generates fancy graphs about TV shows and Movies based on 1529 million user ratings. Find your next binge-watch!
High school girls working on DIY projects, as they struggle, fail, yet don't give up and see the projects through to their end. The story depicts the lives of those girls as they take the first step toward the future.
Hint: you can examine a particular season more clearly on the graphs if you disable the trendline and all other seasons (via clicking on their labels).Episodes average ratingNote: season labels indicates the average rating per episode between the parentheses.Episodes total votesNote: season labels indicates the average votes per episode between the parentheses.History (tracking since March 7, 2020)Note: amount of total votes may decrease due to periodic removal of fraudulent ones.

 Chernobyl
 Arcane
 Dexter: Resurrection
 The Boys
 Bleach: Thousand-Year Blood War
 Invincible
 The Penguin
 WandaVision
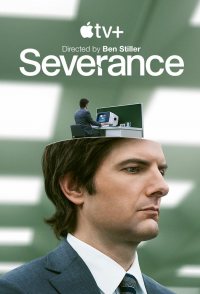 Severance
 Pluribus