Rank is based on the average number of votes per episode adjusted with the average rating. Trend represents the amount of new votes submitted during the past 7 days.
Rank
16,177 / 38,382
Trend
0
Genres
Drama
Seasons
5
Episodes
191
Total votes
3,502
Average votes
18
Average rating
8.2 / 10
Directors: Alexander Singer , Alf Kjellin , Allen H. Miner , Boris Sagal , Buzz Kulik , Corey Allen , David Friedkin , David Lowell Rich , Don Medford , Don Taylor , Elliot Silverstein , Gerald Mayer , Herbert Hirschman , Herschel Daugherty , Ida Lupino , Jack Arnold , Jack Smight , James Goldstone , James Komack , John Brahm , John Newland , Jud Taylor , Jules Bricken , Lamont Johnson , Lawrence Dobkin , Leo Penn , Leonard J. Horn , Marc Daniels , Michael Ritchie , Paul Stanley , Paul Wendkos , Ralph Senensky , Richard C. Sarafian , Robert Butler , Robert Ellis Miller , Robert Gist , Sidney Miller , Sydney Pollack , William A. Graham Writers: Adrian Spies , Alvin Boretz , Andy Lewis , Anthony Lawrence , Archie L. Tegland , Arthur A. Ross , Arthur Alsberg , Arthur Weiss , Benjamin Masselink , Bob Duncan , Boris Sobelman , Bruce Geller , Calvin Clements Sr. , Chester Krumholz , Christopher Knopf , Chuck Menville , Dale Hale , Dalton Sandifer , David P. Harmon , Dick Nelson , Don Balluck , Don Tait , Donald S. Sanford , E. Jack Neuman , Edmund Beloin , Edward J. Lakso , Emmet Lavery , Ernest Kinoy , Frank Pierson , Gene Roddenberry , Gene Wang , George Eckstein , George F. Slavin , Gerald Sanford , Gerry Day , Harold Gast , Harry Kronman , Henry Garson , Irene Winston , Irv Pearlberg , Jack Hanrahan , Jackson Gillis , James Gunn , James Komack , Jameson Brewer , Jean Holloway , Jerome Ross , Jerry de Bono , Jerry McNeely , Jim Thompson , Joel Kane , John Dunkel , John Furia , John Kneubuhl , John T. Dugan , John T. Kelley , John W. Bloch , John Whedon , Ken Kolb , Len Janson , Louis S. Peterson , Margaret Schneider , Marshall Goldberg , Mathilde Ferro , Max Brand , Max Hodge , Meyer Dolinsky , Norman Katkov , Pat Fielder , Paul Schneider , Peggy O'Shea , Peter Packer , Phil Hahn , Philip Saltzman , Richard Fielder , Richard Levinson , Richard Levinson , Rita Lakin , Robert Dozier , Robert Lewin , Robert Pirosh , Sidney Marshall , Stanley Adams , Stanley Niss , Sy Salkowitz , Theodore Apstein , Theodore Ferro , Walter Brough , Wanda Duncan , William Bast , William Jerome Fay , William Link
Hint: you can examine a particular season more clearly on the graphs if you disable the trendline and all other seasons (via clicking on their labels).
Note: season labels indicates the average rating per episode between the parentheses.
Note: season labels indicates the average votes per episode between the parentheses.(tracking since March 7, 2020)
Note: amount of total votes may decrease due to periodic removal of fraudulent ones.
This website uses cookies. We use cookies to personalise content and to analyse our traffic.
 The Twilight Zone
 The Outer Limits
 Doctor Who
 The Alfred Hitchcock Hour
 Colgate Theatre
 The Fugitive
 Thriller
 The Rifleman
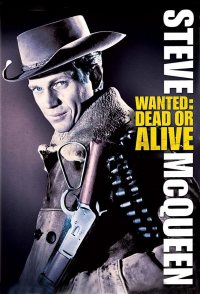 Wanted: Dead or Alive
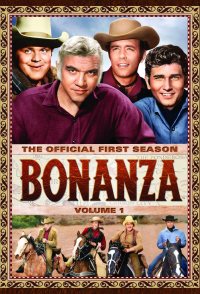 Bonanza