Rating Graph is an online visualization tool which generates fancy graphs about TV shows and Movies based on 1525 million user ratings. Find your next binge-watch!
Join Brad and Barry Klinge, founders of Everyday Paranormal, take ghost hunting to the extreme as they travel the country tackling some of America s most haunted locations and using some of the world's most sophisticated equipment to gather powerful supernatural research.
Hint: you can examine a particular season more clearly on the graphs if you disable the trendline and all other seasons (via clicking on their labels).Episodes average ratingNote: season labels indicates the average rating per episode between the parentheses.Episodes total votesNote: season labels indicates the average votes per episode between the parentheses.History (tracking since March 7, 2020)Note: amount of total votes may decrease due to periodic removal of fraudulent ones.

 30 for 30
 Life's Too Short
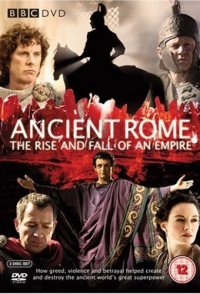 Ancient Rome: The Rise and Fall of an Empire
 Long Way Down
 Through the Wormhole
 Secrets of the Manor House
 Hotel Hell
 Heroes and Villains
 Ancient Aliens
 The Code