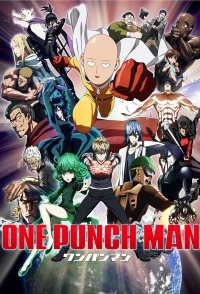
 One Punch Man
Total votes: 250,825
Average rating: 7.2
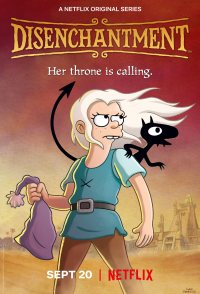 Disenchantment
Total votes: 58,094
Average rating: 7.3
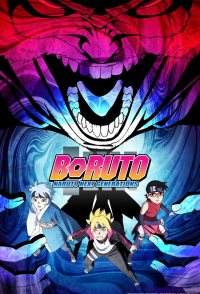 Boruto: Naruto Next Generations
Total votes: 194,694
Average rating: 6.7
 Star Wars: Resistance
Total votes: 21,647
Average rating: 6.5
 Another
Total votes: 5,511
Average rating: 7.4
 Tokyo Ghoul: re
Total votes: 10,004
Average rating: 7.4
 No Game, No Life
Total votes: 4,879
Average rating: 7.4
 High School DxD
Total votes: 19,697
Average rating: 7.4
 Comedians in Cars Getting Coffee
Total votes: 32,256
Average rating: 7.3
 Paradise PD
Total votes: 14,223
Average rating: 6.7