Rating Graph is an online visualization tool which generates fancy graphs about TV shows and Movies based on 1476 million user ratings. Find your next binge-watch!
Guy Fieri invites some of his heavy-hitter chef friends over for a spontaneous cook-off, where everyone comes up with big flavors and tasty dishes that can be made in anyone's kitchen.
Hint: you can examine a particular season more clearly on the graphs if you disable the trendline and all other seasons (via clicking on their labels).Episodes average ratingNote: season labels indicates the average rating per episode between the parentheses.Episodes total votesNote: season labels indicates the average votes per episode between the parentheses.History (tracking since March 7, 2020)Note: amount of total votes may decrease due to periodic removal of fraudulent ones.

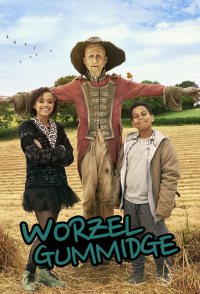 Worzel Gummidge
 The World's Best
 101 Lições de Cinema
 The Lodge
 På tur med far
 Little Big Shots
 Lost in the West
 Holiday Baking Championship
 Emily's Wonder Lab
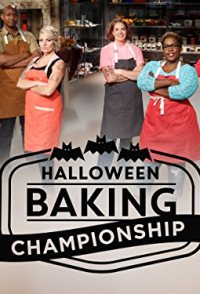 Halloween Baking Championship