Rating Graph is an online visualization tool which generates fancy graphs about TV shows and Movies based on 1461 million user ratings. Find your next binge-watch!
A humorous, year by year look through the decade that saw hair size become a statement, ratty clothes become cool, and music about breaking up become mainstream. Comprised of segments dedicated to the film, music, fashion and big headlines of the 1980s, with commentary from comedians, musicians and others who lived through it and saw the insanity with their own eyes. Offshoot of the very successful "I Love The 70s!" special, and preceded the "I Love The 90s!" special.
Hint: you can examine a particular season more clearly on the graphs if you disable the trendline and all other seasons (via clicking on their labels).Episodes average ratingNote: season labels indicates the average rating per episode between the parentheses.Episodes total votesNote: season labels indicates the average votes per episode between the parentheses.History (tracking since March 7, 2020)Note: amount of total votes may decrease due to periodic removal of fraudulent ones.
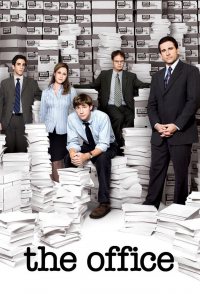 The Office
 How I Met Your Mother
 It's Always Sunny in Philadelphia
 Six Feet Under
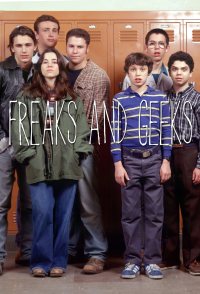 Freaks and Geeks
 The Office
 Arrested Development
 Curb Your Enthusiasm
 Monk
Monk Extras