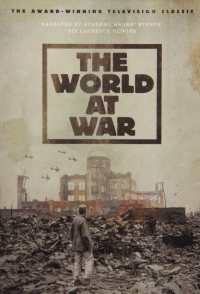
 The World at War
Total votes: 13,485
Average rating: 8.6
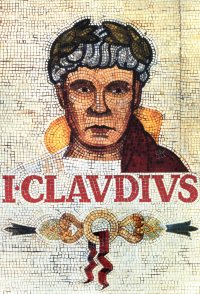 I, Claudius
Total votes: 6,275
Average rating: 8.6
 Scenes from a Marriage
Total votes: 2,721
Average rating: 8.6
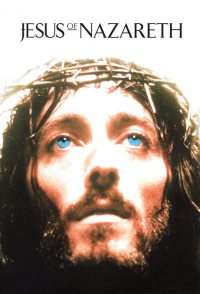 Jesus of Nazareth
Total votes: 1,797
Average rating: 8.5
 Roots
RootsTotal votes: 2,995
Average rating: 8.1
 Tinker Tailor Soldier Spy
Total votes: 2,562
Average rating: 8.1
 The Rockford Files
Total votes: 42,998
Average rating: 8.0
 Space: 1999
Total votes: 17,906
Average rating: 6.6
 The BBC Television Shakespeare
Total votes: 2,593
Average rating: 7.7
 Blake's 7
Total votes: 12,762
Average rating: 7.3