Rating Graph is an online visualization tool which generates fancy graphs about TV shows and Movies based on 1523 million user ratings. Find your next binge-watch!
A collection of bleakly dark comedy sketches pushing the boundaries of taste, decency and television in general, shot using new and different techniques and fading slowly in and out of each other against a slow musical soundtrack. Regular themes include death, insanity and, most often of all, the medical profession.
Hint: you can examine a particular season more clearly on the graphs if you disable the trendline and all other seasons (via clicking on their labels).Episodes average ratingNote: season labels indicates the average rating per episode between the parentheses.Episodes total votesNote: season labels indicates the average votes per episode between the parentheses.History (tracking since March 7, 2020)Note: amount of total votes may decrease due to periodic removal of fraudulent ones.

 Six Feet Under
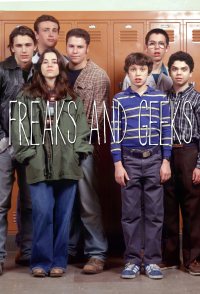 Freaks and Geeks
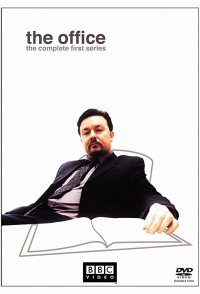 The Office
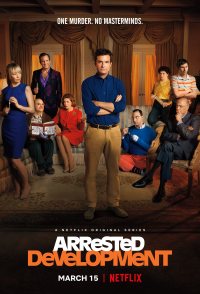 Arrested Development
 Curb Your Enthusiasm
 Comedy Central Roasts
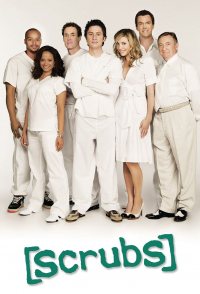 Scrubs
 Monk
 Malcolm in the Middle
 Two and a Half Men