Rating Graph is an online visualization tool which generates fancy graphs about TV shows and Movies based on 1396 million user ratings. Find your next binge-watch!
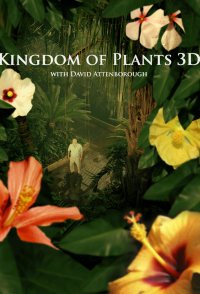
3D technology reveals a whole new dimension in the lives of plants, from the most bizarre to the most beautiful. In this sensational series, shot over the course of a year, David Attenborough explores their fascinating world. Using 3D time-lapse and pioneering techniques in 3D macro photography, he traces them from their beginnings on land to their vital place in nature today, exposing new revelations along the way. He moves from our time scale to theirs, revealing the true nature of plants as creatures that are every bit as dynamic and aggressive as animals. David discovers a microscopic world that's invisible to the naked eye, where insects feed and breed, where flowers fluoresce and where plants communicate with each other and with animals using scent and sound. He meets the extraordinary animals and fungi that have unbreakable ties with the plant world, from hawk moths and bats to tiny poison dart frogs, a giant tortoise and a fungus that can control the mind. And he does all this...
Hint: you can examine a particular season more clearly on the graphs if you disable the trendline and all other seasons (via clicking on their labels).Episodes average ratingNote: season labels indicates the average rating per episode between the parentheses.Episodes total votesNote: season labels indicates the average votes per episode between the parentheses.History (tracking since March 7, 2020)Note: amount of total votes may decrease due to periodic removal of fraudulent ones.
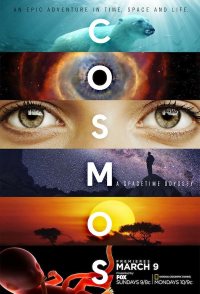 Cosmos: A Spacetime Odyssey
 Nathan for You
 Making a Murderer
 The Jinx: The Life and Deaths of Robert Durst
 The Other Sport
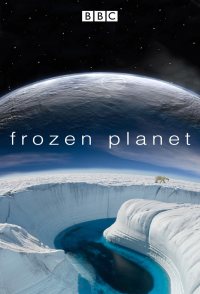 Frozen Planet
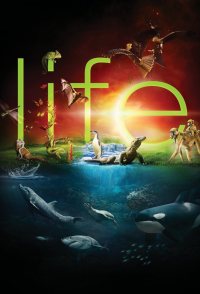 Life
Life Africa
 Apocalypse: The Second World War
 Chef's Table