Rating Graph is an online visualization tool which generates fancy graphs about TV shows and Movies based on 1463 million user ratings. Find your next binge-watch!
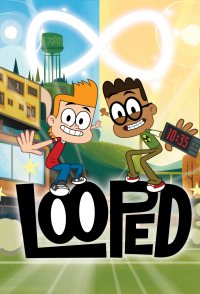
The series revolves around the life and adventures of Luc and Theo, two 12-year-old best friends who get stuck in a time loop where every day is Monday, and as the Monday is always the same, they know everything that will happen before it happens. They use it as an opportunity to do whatever they want to, most primarily at school, what usually gets them in trouble.
Hint: you can examine a particular season more clearly on the graphs if you disable the trendline and all other seasons (via clicking on their labels).Episodes average ratingNote: season labels indicates the average rating per episode between the parentheses.Episodes total votesNote: season labels indicates the average votes per episode between the parentheses.History (tracking since March 7, 2020)Note: amount of total votes may decrease due to periodic removal of fraudulent ones.
 Attack on Titan
 Succession
 Rick and Morty
 BoJack Horseman
 Barry
Barry Fleabag
 Love Doesn't Understand Words
 Girls of the Sun
 Gravity Falls
 Cobra Kai