Rating Graph is an online visualization tool which generates fancy graphs about TV shows and Movies based on 1528 million user ratings. Find your next binge-watch!
This scripted series based on real-life moments from Masaba Gupta's life follows her unique background, the diverse worlds she straddles across fashion and family, and her foray back into the dating world. An inspirational, joyous celebration of her life, this fun series will be packed with tongue-in-cheek humour, enacted by the mother-daughter duo, Masaba, and Neena Gupta themselves.
Hint: you can examine a particular season more clearly on the graphs if you disable the trendline and all other seasons (via clicking on their labels).Episodes average ratingNote: season labels indicates the average rating per episode between the parentheses.Episodes total votesNote: season labels indicates the average votes per episode between the parentheses.History (tracking since March 7, 2020)Note: amount of total votes may decrease due to periodic removal of fraudulent ones.

 She Hulk: Attorney at Law
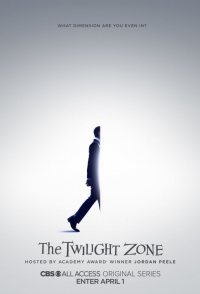 The Twilight Zone
 American Horror Stories
 Tales of the Walking Dead
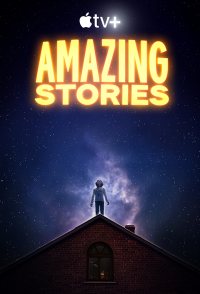 Amazing Stories
 The Idol
 Into the Dark
 The Walking Dead: World Beyond
 Anne Boleyn
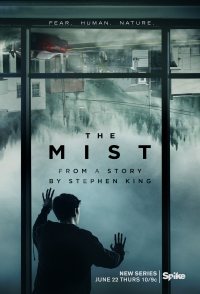 The Mist