Rating Graph is an online visualization tool which generates fancy graphs about TV shows and Movies based on 1454 million user ratings. Find your next binge-watch!
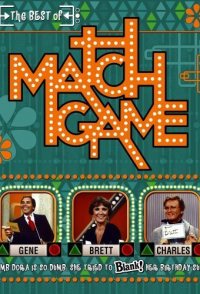
Game show in which 6 guest stars (which change from week to week) are given a humorous phrase with one word missing. The stars write down a word they think would be most appropriate for the missing word, and then two contestants try to guess what the stars have chosen. A point is given for each correct match, and the one with the most points wins.
Hint: you can examine a particular season more clearly on the graphs if you disable the trendline and all other seasons (via clicking on their labels).Episodes average ratingNote: season labels indicates the average rating per episode between the parentheses.Episodes total votesNote: season labels indicates the average votes per episode between the parentheses.History (tracking since March 7, 2020)Note: amount of total votes may decrease due to periodic removal of fraudulent ones.
 Fawlty Towers
 M*A*S*H
 Ripping Yarns
 The Persuaders!
 All in the Family
 Three's Company
 Are You Being Served?
 The Mary Tyler Moore Show
 Porridge
 The Muppet Show