Rating Graph is an online visualization tool which generates fancy graphs about TV shows and Movies based on 1463 million user ratings. Find your next binge-watch!
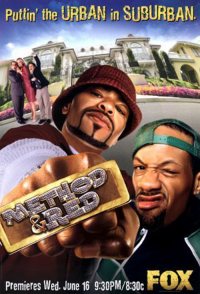
Real life actors/rap artists Method Man and Redman play themselves as they move into a comfortable luxury estate from the success of their recording albums and acting gigs and then try to fit in with the uptight, predominately Caucasian community whom try to evict them for their wild party gatherings while gaining admiration from a handful of neighbor eccentrics including the young son of their real estate agent whom live just next door.
Hint: you can examine a particular season more clearly on the graphs if you disable the trendline and all other seasons (via clicking on their labels).Episodes average ratingNote: season labels indicates the average rating per episode between the parentheses.Episodes total votesNote: season labels indicates the average votes per episode between the parentheses.History (tracking since March 7, 2020)Note: amount of total votes may decrease due to periodic removal of fraudulent ones.
 The Office
 How I Met Your Mother
 The Big Bang Theory
 The IT Crowd
 Arrested Development
 Monk
Monk Extras
 Scrubs
 Psych
Psych Two and a Half Men