Rating Graph is an online visualization tool which generates fancy graphs about TV shows and Movies based on 1453 million user ratings. Find your next binge-watch!
Tom Rhodes is the new hip writer. He has written one novel which was critically acclaimed but a commercial failure. He must resort to teaching at his old prep school where he meets some familiar faces and old demons. But what do you do when the teacher is often more undisciplined than his students?
Hint: you can examine a particular season more clearly on the graphs if you disable the trendline and all other seasons (via clicking on their labels).Episodes average ratingNote: season labels indicates the average rating per episode between the parentheses.Episodes total votesNote: season labels indicates the average votes per episode between the parentheses.History (tracking since March 7, 2020)Note: amount of total votes may decrease due to periodic removal of fraudulent ones.

 The Wonderful World of Disney
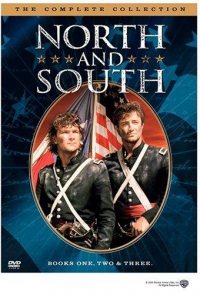 North & South: Book 3, Heaven & Hell
 Click
Click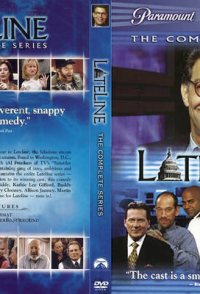 LateLine
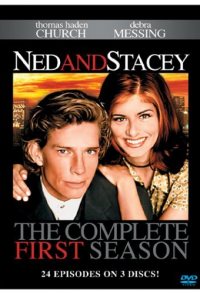 Ned and Stacey
 Love Reinvented
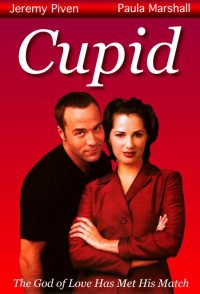 Cupid
Cupid High Tide
 Comedy Now!
 Veronica's Closet