Rating Graph is an online visualization tool which generates fancy graphs about TV shows and Movies based on 1423 million user ratings. Find your next binge-watch!
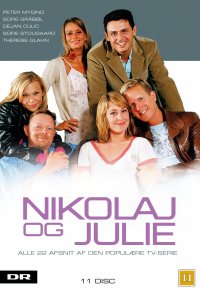
Nikolaj and Julie are a couple in their early thirties, married and with a baby that they both find infinitely adorable. As workloads and unfulfilled expectations mount, their feelings towards each other are not always equally sympathetic in nature. Joining them in their Copenhagen lives are friends Frank and Karina, a married couple who direct their everyday lives according to strict rules, as well as actress-with-money-problems Søs and playboyish Philip, who enjoys his single-life freedom.
Hint: you can examine a particular season more clearly on the graphs if you disable the trendline and all other seasons (via clicking on their labels).Episodes average ratingNote: season labels indicates the average rating per episode between the parentheses.Episodes total votesNote: season labels indicates the average votes per episode between the parentheses.History (tracking since March 7, 2020)Note: amount of total votes may decrease due to periodic removal of fraudulent ones.
 Wallander
 A Ghost Story for Christmas
 The Twilight Zone
 According to Jim
 Koffee with Karan
 Salem's Lot
 Kingdom Hospital
 Earthsea
 Donna Leon
 Frankenstein