Rating Graph is an online visualization tool which generates fancy graphs about TV shows and Movies based on 1423 million user ratings. Find your next binge-watch!
Peter, a junior executive at a New York business, figures out that single men at his company are generally passed over in favor of married men, who the top execs think are more stable. So Peter asks his friend and upstairs neighbor, Greta, if she'd be willing to pose as his wife for company functions. She agrees, not knowing how it'd affect her personal life. And whenever someone from his company unexpectantly dropped by "their" apartment, Peter would run up the fire escape two floors to fetch Greta, much to the bemusement of their neighbor in-between.
Hint: you can examine a particular season more clearly on the graphs if you disable the trendline and all other seasons (via clicking on their labels).Episodes average ratingNote: season labels indicates the average rating per episode between the parentheses.Episodes total votesNote: season labels indicates the average votes per episode between the parentheses.History (tracking since March 7, 2020)Note: amount of total votes may decrease due to periodic removal of fraudulent ones.

 Lost in Space
 Laredo
 The Doris Day Show
 Love, American Style
 Till Death Us Do Part
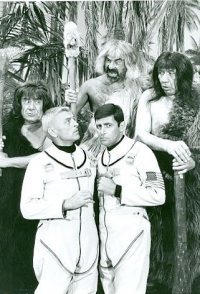 It's About Time
 Do Not Adjust Your Set
 Good Morning World
 Curry & Chips
 Please Sir!