Rating Graph is an online visualization tool which generates fancy graphs about TV shows and Movies based on 1494 million user ratings. Find your next binge-watch!
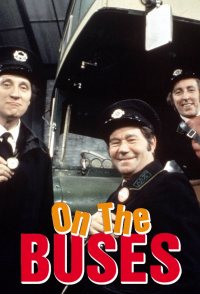
The trials and tribulations of bus driver Stan and his conductor Jack unfold in this weekly comedy. The bain of their working life is Inspector Blake who'll do anything to make their lives a misery... and does. Stan and Jack are a couple of "jack-the-lads" who are not averse to clocking a bit of crumpet here and there, but "Blakey" is constantly dampening their ardor.
Hint: you can examine a particular season more clearly on the graphs if you disable the trendline and all other seasons (via clicking on their labels).Episodes average ratingNote: season labels indicates the average rating per episode between the parentheses.Episodes total votesNote: season labels indicates the average votes per episode between the parentheses.History (tracking since March 7, 2020)Note: amount of total votes may decrease due to periodic removal of fraudulent ones.
 Monty Python's Flying Circus
 M*A*S*H
 Batman
 The Persuaders!
 All in the Family
 Are You Being Served?
 The Mary Tyler Moore Show
 The Brady Bunch
 Monty Python's Fliegender Zirkus
 Emergency!