Rating Graph is an online visualization tool which generates fancy graphs about TV shows and Movies based on 1528 million user ratings. Find your next binge-watch!
This semi-autobiographical dark comedy starring Tig Notaro follows her as she returns to her hometown after the sudden death of her mother. Still reeling from her own declining health problems, Tig struggles to find her footing with the loss of the one person in her life who understood her. All while dealing with her clingy girlfriend and her dysfunctional family.
Hint: you can examine a particular season more clearly on the graphs if you disable the trendline and all other seasons (via clicking on their labels).Episodes average ratingNote: season labels indicates the average rating per episode between the parentheses.Episodes total votesNote: season labels indicates the average votes per episode between the parentheses.History (tracking since March 7, 2020)Note: amount of total votes may decrease due to periodic removal of fraudulent ones.

 Stranger Things
 Better Call Saul
 Dark
 True Detective
 Mr. Robot
 Succession
 Peaky Blinders
 Westworld
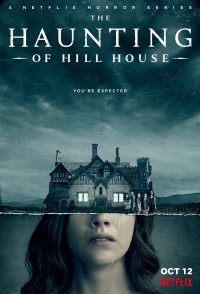 The Haunting of Hill House
 Hannibal