Rating Graph is an online visualization tool which generates fancy graphs about TV shows and Movies based on 1458 million user ratings. Find your next binge-watch!
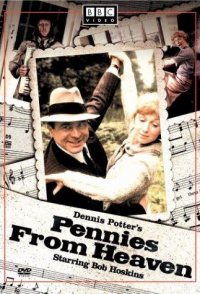
Arthur, a sheet music salesman, has an ear for the hit tunes, but nobody will trust it. And his imagination often bursts into full song, building musical numbers around the greatest frustrations in his life. He meets an innocent young school teacher, Eileen, who seems to hear the same music, but when Eileen learns that he's married, and that she's pregnant with his child, she runs away. Arthur gives up everything to find and protect her, but fate and the music haven't finished with Arthur Parker.
Hint: you can examine a particular season more clearly on the graphs if you disable the trendline and all other seasons (via clicking on their labels).Episodes average ratingNote: season labels indicates the average rating per episode between the parentheses.Episodes total votesNote: season labels indicates the average votes per episode between the parentheses.History (tracking since March 7, 2020)Note: amount of total votes may decrease due to periodic removal of fraudulent ones.
 The Adventures of Sherlock Holmes and Dr. Watson
 I, Claudius
 Jesus of Nazareth
 Roots
Roots Tinker Tailor Soldier Spy
 Shogun
 Berlin Alexanderplatz
 Space: 1999
 Brideshead Revisited
 Blake's 7