Rating Graph is an online visualization tool which generates fancy graphs about TV shows and Movies based on 1422 million user ratings. Find your next binge-watch!
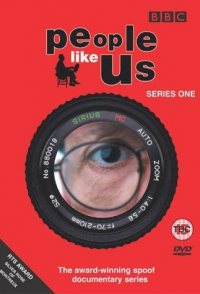
Before there was The Office, there was People Like Us. A mockumentary in the style of the "docusoap" British reality television shows popular at the time about regular people and their regular lives, People Like Us follows actors playing average citizens going about their days working (or failing to do so), with an inept interviewer in tow, frequently getting sidetracked or becoming haplessly involved with his subjects. It is perfectly droll and quintessentially British, with a slew of great deadpan actors, some of whom have gone on to gain larger fame.
Hint: you can examine a particular season more clearly on the graphs if you disable the trendline and all other seasons (via clicking on their labels).Episodes average ratingNote: season labels indicates the average rating per episode between the parentheses.Episodes total votesNote: season labels indicates the average votes per episode between the parentheses.History (tracking since March 7, 2020)Note: amount of total votes may decrease due to periodic removal of fraudulent ones.
 Six Feet Under
 Freaks and Geeks
 The Office
 Curb Your Enthusiasm
 Monk
Monk Scrubs
 Spaced
 Malcolm in the Middle
 Gilmore Girls
 That '70s Show