Rating Graph is an online visualization tool which generates fancy graphs about TV shows and Movies based on 1419 million user ratings. Find your next binge-watch!
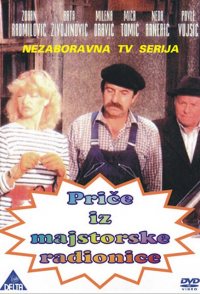
Dealing with his customers with an open heart a car mechanic named Zivota goes through many adventures. Some are funny, some are sad, some reveal beauty and others human misery. In the end he gets tangled up himself, and not without bitterness he tries to change his ways, trying to become like his competitor across the street, which has adapted to modern times: strictly business. But, people who come to him need him just the way he is...
Hint: you can examine a particular season more clearly on the graphs if you disable the trendline and all other seasons (via clicking on their labels).Episodes average ratingNote: season labels indicates the average rating per episode between the parentheses.Episodes total votesNote: season labels indicates the average votes per episode between the parentheses.History (tracking since March 7, 2020)Note: amount of total votes may decrease due to periodic removal of fraudulent ones.
 Sherlock Holmes and Doctor Watson
 Police Squad!
 Only Fools and Horses
 The Young Ones
 Yes Minister
 The Hitch Hiker's Guide to the Galaxy
 'Allo 'Allo!
 WKRP in Cincinnati
 Square Pegs
 SCTV Network