Rating Graph is an online visualization tool which generates fancy graphs about TV shows and Movies based on 1528 million user ratings. Find your next binge-watch!
A group of seemingly unrelated strangers all receive a mysterious note stating "I know what you did", and it sends their lives into a downward spiral. They include a birthing coach nurse who believes her practice doll is a real baby; an alcoholic, one-handed clown; a young man obsessed with serial killers; a telekinetic dwarf; and a miserly old man with the world's biggest Beanie Baby collection.
Hint: you can examine a particular season more clearly on the graphs if you disable the trendline and all other seasons (via clicking on their labels).Episodes average ratingNote: season labels indicates the average rating per episode between the parentheses.Episodes total votesNote: season labels indicates the average votes per episode between the parentheses.History (tracking since March 7, 2020)Note: amount of total votes may decrease due to periodic removal of fraudulent ones.

 Community
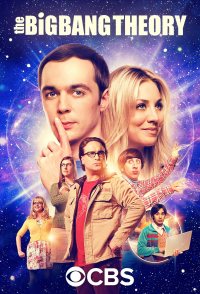 The Big Bang Theory
 Suits
 The IT Crowd
 Parks and Recreation
 Shameless
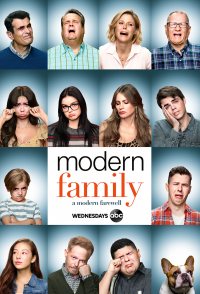 Modern Family
 Castle
 Chuck
 The Inbetweeners