Rating Graph is an online visualization tool which generates fancy graphs about TV shows and Movies based on 1422 million user ratings. Find your next binge-watch!
It is 1930s Pittsburgh, and college student Betty Roberts has won an internship at WENN, a station that specializes in radio shows. She finds that the employees of the shows are just as wacky as the characters they play on the radio. They include: Mackie Bloom, WENN's man of a thousand voices; Hilary Booth, queen of the stage who carries an over-inflated ego; Mr. Foley, WENNs sound effects man who never talks; Tom Eldridge, who is as clueless as a gnat; and Jeffery Singer, who is in a marriage of convenience with Hillary. Each week, we watch how the station members struggle to keep the station going.
Hint: you can examine a particular season more clearly on the graphs if you disable the trendline and all other seasons (via clicking on their labels).Episodes average ratingNote: season labels indicates the average rating per episode between the parentheses.Episodes total votesNote: season labels indicates the average votes per episode between the parentheses.History (tracking since March 7, 2020)Note: amount of total votes may decrease due to periodic removal of fraudulent ones.

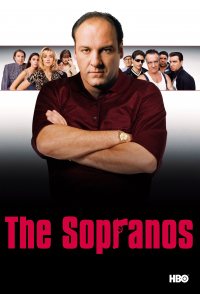 The Sopranos
 Friends
 The X-Files
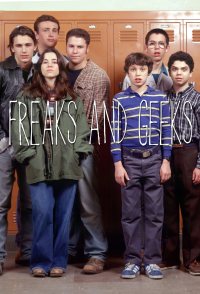 Freaks and Geeks
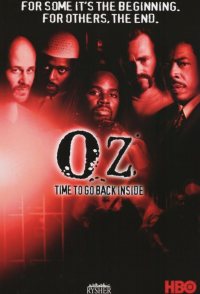 Oz
Oz The West Wing
 Spaced
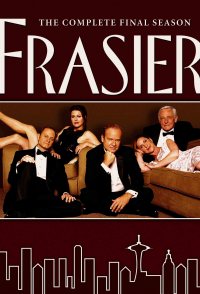 Frasier
 Law & Order: Special Victims Unit
 Father Ted