
 Histoire(s) du cinéma
Total votes: 6,293
Average rating: 7.1
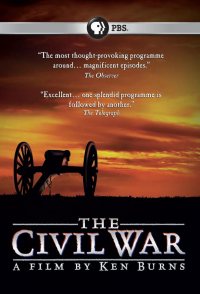 The Civil War
Total votes: 4,102
Average rating: 8.6
 Born in the USSR
Total votes: 888
Average rating: 8.1
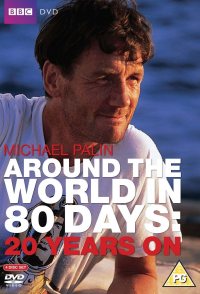 Around the World in 80 Days
Total votes: 875
Average rating: 8.1
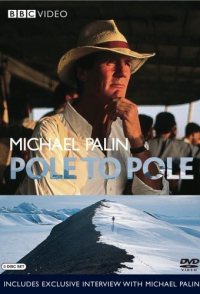 Pole to Pole
Total votes: 852
Average rating: 8.0
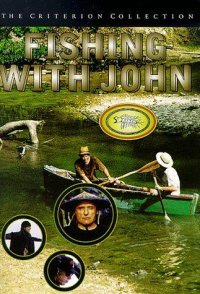 Fishing with John
Total votes: 597
Average rating: 7.7
 The Trials of Life
Total votes: 788
Average rating: 8.9
 American Experience
Total votes: 35,163
Average rating: 7.4
 Joseph Campbell and the Power of Myth
Total votes: 333
Average rating: 8.1
 MTV Unplugged
Total votes: 6,510
Average rating: 7.7