Rating Graph is an online visualization tool which generates fancy graphs about TV shows and Movies based on 1528 million user ratings. Find your next binge-watch!
A slice-of-life show that explores the lives of 5 quirky school teenagers who've just entered 11th Commerce, as they navigate friendships, heartbreaks, peer pressures, more importantly figuring out who they really want to be. All this in a society that finds it difficult to cope with the fast-changing Gen Z world.
Hint: you can examine a particular season more clearly on the graphs if you disable the trendline and all other seasons (via clicking on their labels).Episodes average ratingNote: season labels indicates the average rating per episode between the parentheses.Episodes total votesNote: season labels indicates the average votes per episode between the parentheses.History (tracking since March 7, 2020)Note: amount of total votes may decrease due to periodic removal of fraudulent ones.

 Heated Rivalry
 WandaVision
 Dhindora
 One Piece
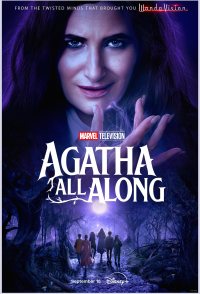 Agatha All Along
 Peacemaker
 Another Love
 Wednesday
 Ted Lasso
 Love Is in the Air