Rating Graph is an online visualization tool which generates fancy graphs about TV shows and Movies based on 1423 million user ratings. Find your next binge-watch!
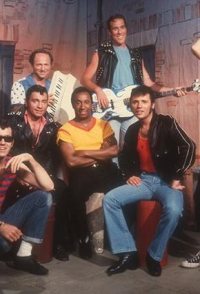
A themed variety show, in which the skits and music centered around Sha Na Na (a '50s-style "greaser" rock band) and the neighborhood in which they lived (an unidentified inner city neighborhood reminiscent of the Bronx).
Hint: you can examine a particular season more clearly on the graphs if you disable the trendline and all other seasons (via clicking on their labels).Episodes average ratingNote: season labels indicates the average rating per episode between the parentheses.Episodes total votesNote: season labels indicates the average votes per episode between the parentheses.History (tracking since March 7, 2020)Note: amount of total votes may decrease due to periodic removal of fraudulent ones.
 Fawlty Towers
 Sherlock Holmes and Doctor Watson
 Yes Minister
 Ripping Yarns
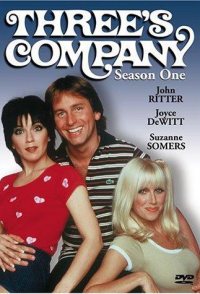 Three's Company
 The Norman Conquests
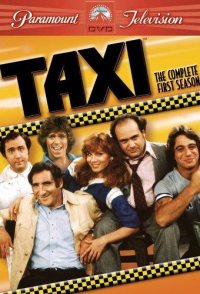 Taxi
Taxi Porridge
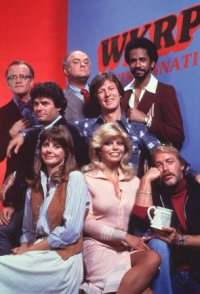 WKRP in Cincinnati
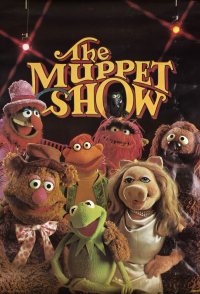 The Muppet Show