Rating Graph is an online visualization tool which generates fancy graphs about TV shows and Movies based on 1422 million user ratings. Find your next binge-watch!
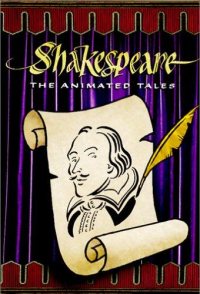
Shakespeare: The Animated Tales ratings (TV show, 1992-1994)
An animated adaptation of twelve of Shakespeare's best-known plays. The series was produced by S4C for the BBC, but animated by some of the foremost artists of Soyuzmultfilm, the former Soviet Union's main animation studio. Each 26-minute play is directed by a different animator, in a wide variety of styles: cel animation for Macbeth, stop-motion puppets in Twelfth Night, and paint on glass for Hamlet.
Hint: you can examine a particular season more clearly on the graphs if you disable the trendline and all other seasons (via clicking on their labels).Episodes average ratingNote: season labels indicates the average rating per episode between the parentheses.Episodes total votesNote: season labels indicates the average votes per episode between the parentheses.History (tracking since March 7, 2020)Note: amount of total votes may decrease due to periodic removal of fraudulent ones.
 Friends
 Seinfeld
 Neon Genesis Evangelion
 Mr. Bean
 Batman: The Animated Series
 Blackadder Goes Forth
 Dragon Ball Z
 Frasier
 X-Men
X-Men Spider-Man: The Animated Series