Rating Graph is an online visualization tool which generates fancy graphs about TV shows and Movies based on 1457 million user ratings. Find your next binge-watch!
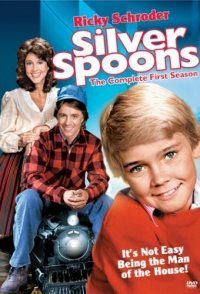
The story of young Ricky Stratton and his millionaire father, Edward, who lives very much like a young boy himself, in a house filled floor to ceiling with toys. Still, Edward takes raising Ricky seriously, and tries to avoid spoiling him while still letting him enjoy his childhood.
Hint: you can examine a particular season more clearly on the graphs if you disable the trendline and all other seasons (via clicking on their labels).Episodes average ratingNote: season labels indicates the average rating per episode between the parentheses.Episodes total votesNote: season labels indicates the average votes per episode between the parentheses.History (tracking since March 7, 2020)Note: amount of total votes may decrease due to periodic removal of fraudulent ones.
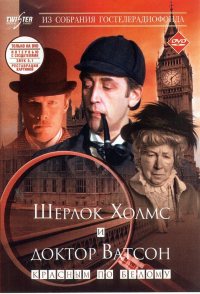 Sherlock Holmes and Doctor Watson
 Police Squad!
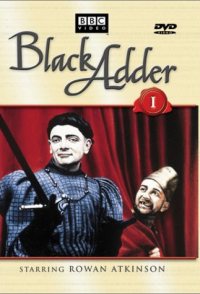 Blackadder
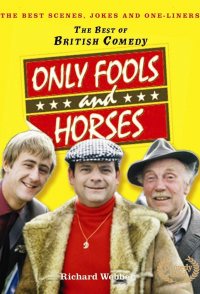 Only Fools and Horses
 The Young Ones
 Cheers
 The Golden Girls
 Yes Minister
 The Hitch Hiker's Guide to the Galaxy
 Moonlighting