Rating Graph is an online visualization tool which generates fancy graphs about TV shows and Movies based on 1422 million user ratings. Find your next binge-watch!
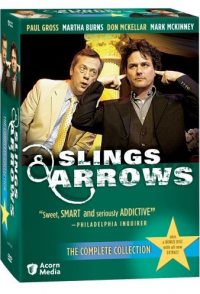
In the fictional town of New Burbage, legendary theatrical madman Geoffrey Tennant returns to the New Burbage Theatre Festival, the site of his greatest triumph and most humiliating failure, to assume the artistic directorship after the sudden death of his mentor, Oliver Welles. When Geoffrey arrives he finds that Oliver is still there, in spirit anyway, and with his guidance (and often in spite of it) Geoffrey attempts to reconcile with his past while wrestling the festival back from the marketing department. Despite a bitter leading lady, a clueless leading man, and a scheming general manager, he manages to stage a remarkable production of Hamlet -- the play that drove him mad.
Hint: you can examine a particular season more clearly on the graphs if you disable the trendline and all other seasons (via clicking on their labels).Episodes average ratingNote: season labels indicates the average rating per episode between the parentheses.Episodes total votesNote: season labels indicates the average votes per episode between the parentheses.History (tracking since March 7, 2020)Note: amount of total votes may decrease due to periodic removal of fraudulent ones.
 The Office
 How I Met Your Mother
 It's Always Sunny in Philadelphia
 Six Feet Under
 The IT Crowd
 The Office
 Arrested Development
 Curb Your Enthusiasm
 Monk
Monk Extras