Rating Graph is an online visualization tool which generates fancy graphs about TV shows and Movies based on 1520 million user ratings. Find your next binge-watch!
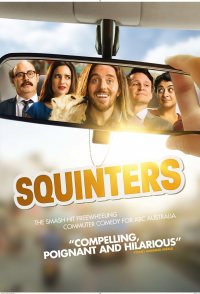
Squinters follows commuters in peak hour transit as they drive to work. The title Squinters, refers to the fact that the commuters are facing the sun as they head east from Sydney's western suburbs in the mornings, and then also face into the sun in the afternoons on the way back to the western suburbs.
Hint: you can examine a particular season more clearly on the graphs if you disable the trendline and all other seasons (via clicking on their labels).Episodes average ratingNote: season labels indicates the average rating per episode between the parentheses.Episodes total votesNote: season labels indicates the average votes per episode between the parentheses.History (tracking since March 7, 2020)Note: amount of total votes may decrease due to periodic removal of fraudulent ones.
 Stranger Things
 The Boys
 Better Call Saul
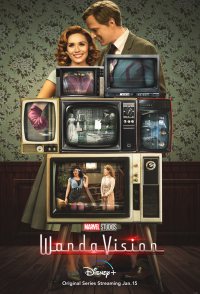 WandaVision
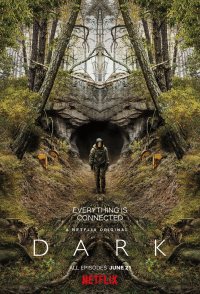 Dark
Dark Mr. Robot
 Dhindora
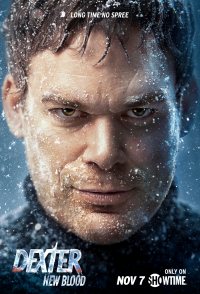 Dexter: New Blood
 Succession
 Westworld