Rating Graph is an online visualization tool which generates fancy graphs about TV shows and Movies based on 1422 million user ratings. Find your next binge-watch!
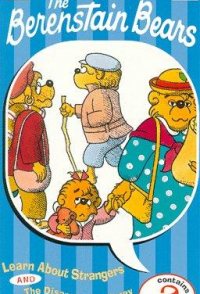
We follow a family of bears, known as the Berenstain Bears, as they figure out life together. With friendly neighbors and close friends, the journey is never boring. Inspired by the book series written by Stan and Jan Berenstain.
Hint: you can examine a particular season more clearly on the graphs if you disable the trendline and all other seasons (via clicking on their labels).Episodes average ratingNote: season labels indicates the average rating per episode between the parentheses.Episodes total votesNote: season labels indicates the average votes per episode between the parentheses.History (tracking since March 7, 2020)Note: amount of total votes may decrease due to periodic removal of fraudulent ones.
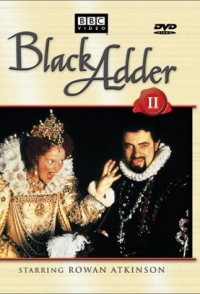 Blackadder II
 Blackadder the Third
 Police Squad!
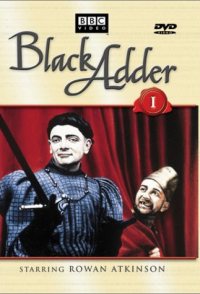 Blackadder
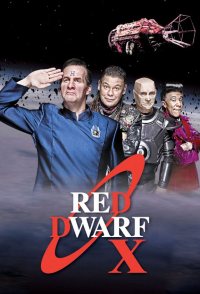 Red Dwarf
 The Young Ones
 Married... with Children
 Cheers
 The Golden Girls
 Mystery Science Theater 3000