
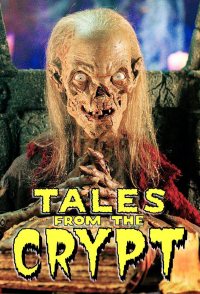
 Tales from the Crypt
Total votes: 94,747
Average rating: 6.7
 Monsters
Total votes: 11,645
Average rating: 6.2
 Big Man
Total votes: 1,012
Average rating: 5.9
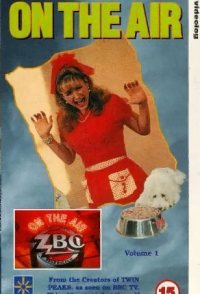 On the Air
Total votes: 717
Average rating: 6.7
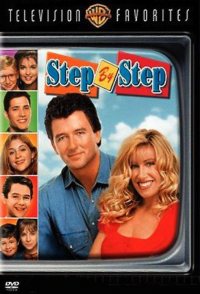 Step by Step
Total votes: 14,865
Average rating: 6.7
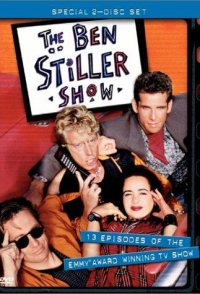 The Ben Stiller Show
Total votes: 936
Average rating: 6.8
 The Bradys
Total votes: 198
Average rating: 6.5
 Dream On
Total votes: 4,339
Average rating: 6.7
 Anything But Love
Total votes: 1,076
Average rating: 6.6
 Down the Shore
Total votes: 358
Average rating: 6.7