Rating Graph is an online visualization tool which generates fancy graphs about TV shows and Movies based on 1473 million user ratings. Find your next binge-watch!
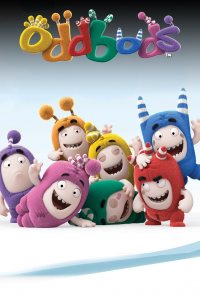
Oddbods is a sketch-based series following the adventures of seven adorable characters as they laugh, fool, and trip their way through the most seemingly ordinary situations, often with unexpected consequences. Each Oddbod has a distinct personality that was created to appeal to adults and children alike. Everything is about to get a little odd.
Hint: you can examine a particular season more clearly on the graphs if you disable the trendline and all other seasons (via clicking on their labels).Episodes average ratingNote: season labels indicates the average rating per episode between the parentheses.Episodes total votesNote: season labels indicates the average votes per episode between the parentheses.History (tracking since March 7, 2020)Note: amount of total votes may decrease due to periodic removal of fraudulent ones.
 The Boys
 Succession
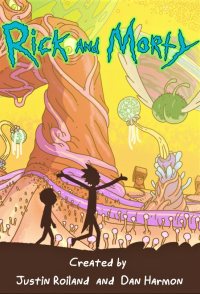 Rick and Morty
 Love, Death & Robots
 Vinland Saga
 Re: Zero - Starting Life in Another World
 BoJack Horseman
 Demon Slayer: Kimetsu no Yaiba
 Barry
Barry Fleabag