Rating Graph is an online visualization tool which generates fancy graphs about TV shows and Movies based on 1530 million user ratings. Find your next binge-watch!
This series tells the stories of desperate people who come by to eat a magical dish with the hopes of having their personal wishes granted, even at the expense of their own souls.
Hint: you can examine a particular season more clearly on the graphs if you disable the trendline and all other seasons (via clicking on their labels).Episodes average ratingNote: season labels indicates the average rating per episode between the parentheses.Episodes total votesNote: season labels indicates the average votes per episode between the parentheses.History (tracking since March 7, 2020)Note: amount of total votes may decrease due to periodic removal of fraudulent ones.

 The Boys
 The Penguin
 WandaVision
 Severance
 Dhindora
 Dexter: New Blood
 Succession
 One Piece
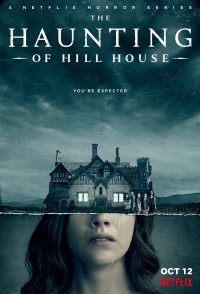 The Haunting of Hill House
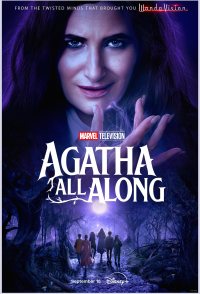 Agatha All Along