Rating Graph is an online visualization tool which generates fancy graphs about TV shows and Movies based on 1461 million user ratings. Find your next binge-watch!
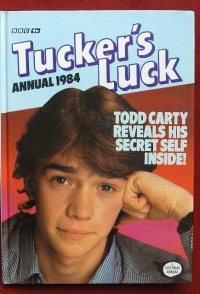
The further adventures of Tucker Jenkins and his former classmates from Grange Hill. Follow Tucker and friends as they duck and dive their way through love and life during a time of high unemployment in the 1980s.
Hint: you can examine a particular season more clearly on the graphs if you disable the trendline and all other seasons (via clicking on their labels).Episodes average ratingNote: season labels indicates the average rating per episode between the parentheses.Episodes total votesNote: season labels indicates the average votes per episode between the parentheses.History (tracking since March 7, 2020)Note: amount of total votes may decrease due to periodic removal of fraudulent ones.
 The Return of Sherlock Holmes
 Hammer House of Horror
 Murder, She Wrote
 Shogun
 Berlin Alexanderplatz
 The Twilight Zone
 Shades of Darkness
 Screen Two
 Fox Mystery Theater
 Miss Marple: The Body in the Library