Rating Graph is an online visualization tool which generates fancy graphs about TV shows and Movies based on 1450 million user ratings. Find your next binge-watch!
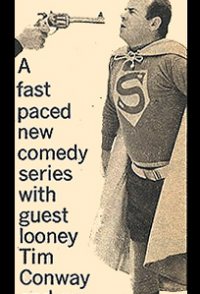
A multimedia presentation satirizing sex, politics, and everything else, splattered across the screen at blinding speed. One producer called it "A visual, comedic, sensory assault involving animation, videotape, stop-action film, electronic distortion, computer.
Hint: you can examine a particular season more clearly on the graphs if you disable the trendline and all other seasons (via clicking on their labels).Episodes average ratingNote: season labels indicates the average rating per episode between the parentheses.Episodes total votesNote: season labels indicates the average votes per episode between the parentheses.History (tracking since March 7, 2020)Note: amount of total votes may decrease due to periodic removal of fraudulent ones.
 Bless This House
 It's About Time
 Do Not Adjust Your Set
 Good Morning World
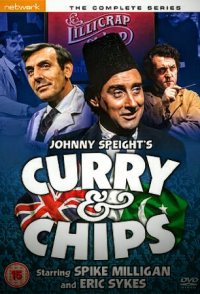 Curry & Chips
 Please Sir!
 Anna and the King
 Mr. Terrific
 My World and Welcome to It
 The Beachcombers