Rating Graph is an online visualization tool which generates fancy graphs about TV shows and Movies based on 1531 million user ratings. Find your next binge-watch!
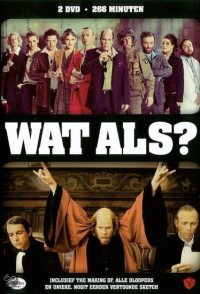
What If? is a sketch show. Each sketch begins with a question. Each question begins with "what if". What if Barbie were a real woman? What if the Titanic had never sunk? What if butchers were rock stars? "WHAT IF?" is a roller coaster of sketches that, for 22 minutes, immerses you in life as it almost could be.
Hint: you can examine a particular season more clearly on the graphs if you disable the trendline and all other seasons (via clicking on their labels).Episodes average ratingNote: season labels indicates the average rating per episode between the parentheses.Episodes total votesNote: season labels indicates the average votes per episode between the parentheses.History (tracking since March 7, 2020)Note: amount of total votes may decrease due to periodic removal of fraudulent ones.
 2 Broke Girls
 Z Nation
 Ebb and Tide
 Agatha Raisin
 Henry Danger
 Cougar Town
 Black-ish
 Breaking Bad: Original Minisodes
 Sam & Cat
 House of Lies