Rating Graph is an online visualization tool which generates fancy graphs about TV shows and Movies based on 1457 million user ratings. Find your next binge-watch!
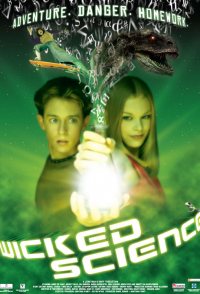
While working on a class assignment with the teacher's pet, Toby is struck with a wave of energy that makes him a super genius in science. But while he uses his gift to pass class and help his friends, Elizabeth, the other student who was hit with the same wave of energy, becomes a evil genius who wants to rule the school and Toby's heart.
Hint: you can examine a particular season more clearly on the graphs if you disable the trendline and all other seasons (via clicking on their labels).Episodes average ratingNote: season labels indicates the average rating per episode between the parentheses.Episodes total votesNote: season labels indicates the average votes per episode between the parentheses.History (tracking since March 7, 2020)Note: amount of total votes may decrease due to periodic removal of fraudulent ones.
 Dexter
 Lost
Lost Doctor Who
 The Office
 The Wire
 Firefly
 Supernatural
 How I Met Your Mother
 House
House It's Always Sunny in Philadelphia