Rating Graph is an online visualization tool which generates fancy graphs about TV shows and Movies based on 1524 million user ratings. Find your next binge-watch!
It all begins when the wealthy real estate shark Gordon Stuart is murdered in a lonely villa by his wife Diana and his closest collaborator Mark Paxton. When Mark wants to get rid of the corpse, it suddenly disappears. A nerve-wracking game of "cat and mouse" turns the perpetrators into victims. Inspector Clay investigates and soon stumbles across more corpses
Hint: you can examine a particular season more clearly on the graphs if you disable the trendline and all other seasons (via clicking on their labels).Episodes average ratingNote: season labels indicates the average rating per episode between the parentheses.Episodes total votesNote: season labels indicates the average votes per episode between the parentheses.History (tracking since March 7, 2020)Note: amount of total votes may decrease due to periodic removal of fraudulent ones.

 UFO
 World on a Wire
 Kojak
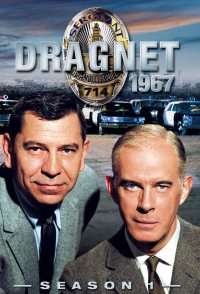 Dragnet 1967
 Mannix
 The Streets of San Francisco
 Cannon
 McCloud
 Harry O
 Department S