Rating Graph is an online visualization tool which generates fancy graphs about TV shows and Movies based on 1521 million user ratings. Find your next binge-watch!
What do you do after graduating college? Go to work. And that is exactly what Matt wants to do. He wants to climb up the corporate ladder the old-fashion way: by working. But with the bizarre employees that can be found in a multinational corporation, it looks like a long and hard climb to the top.
Hint: you can examine a particular season more clearly on the graphs if you disable the trendline and all other seasons (via clicking on their labels).Episodes average ratingNote: season labels indicates the average rating per episode between the parentheses.Episodes total votesNote: season labels indicates the average votes per episode between the parentheses.History (tracking since March 7, 2020)Note: amount of total votes may decrease due to periodic removal of fraudulent ones.

 The Wonderful World of Disney
 Goosebumps
 Sabrina the Teenage Witch
 Lexx
Lexx My Wife and Kids
 Gulliver's Travels
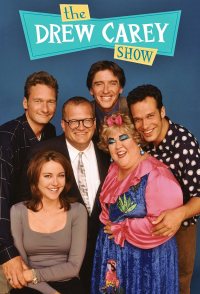 The Drew Carey Show
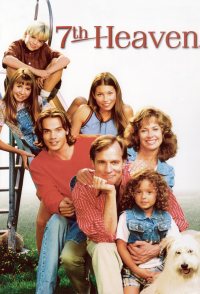 7th Heaven
 Thunder in Paradise
 Neverwhere