Rating Graph is an online visualization tool which generates fancy graphs about TV shows and Movies based on 1423 million user ratings. Find your next binge-watch!
A live CBS half-hour dramatic anthology series, but on two networks in its second season (as "Bigelow-Sanford Theater"); Sunday evenings over CBS and Thursday evenings over DuMont.
Hint: you can examine a particular season more clearly on the graphs if you disable the trendline and all other seasons (via clicking on their labels).Episodes average ratingNote: season labels indicates the average rating per episode between the parentheses.Episodes total votesNote: season labels indicates the average votes per episode between the parentheses.History (tracking since March 7, 2020)Note: amount of total votes may decrease due to periodic removal of fraudulent ones.

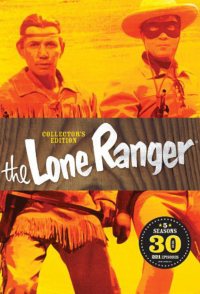 The Lone Ranger
 Campbell Summer Soundstage
 Death Valley Days
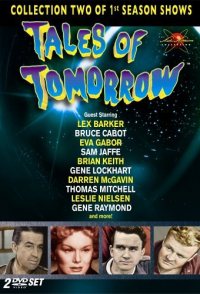 Tales of Tomorrow
 BBC Sunday-Night Theatre
 Kraft Theatre
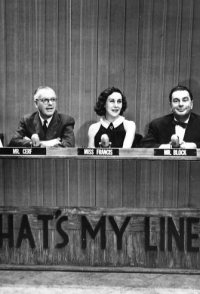 What's My Line?
 Encounter
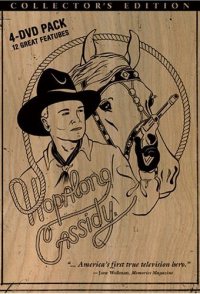 Hopalong Cassidy
 Omnibus